Nowadays, every business organization wants to have a robust application to make clients happy. For this, they hire a .NET software development company that uses this open-source framework to create web applications and services with the use of HTML, CSS, and JavaScript. But one concern that the app development team has is keeping the app up-to-date, robust, and error-free for the end-users. For this, .NET developers keep factors like monitoring and debugging of the app into consideration. And when it comes to monitoring the application’s performance, its memory usage, and memory leaks, there are many different types of tools available in the market. These ASP.NET monitoring tools enable the developers to optimize the app’s performance and offer quick assistance during critical events.
In this blog, we will learn more about .NET monitoring tools, their types, and popular tools used by developers these days.
1. Types of .NET Monitoring Tools

There are three main types of ASP .NET performance monitoring tools available in the market –
1.1 Standard Tools
Standard .NET monitoring tools are those that help developers to resolve issues related to bad memory and CPU usage. Basically, when the usage of the CPU is out of control, the .NET development team chooses to have a standard approach. It comes with proactive CPU performance tuning. The standard approach also helps in monitoring the high memory usage, finding memory leaks, and optimizing memory usage. But all these features are known as resource-intensive approaches which can slow down the software application.
1.2 Lightweight Tools
Next in line is lightweight .NET monitoring tools which developers prefer to use every day. It offers less performance impact on the source code of the application. The architecture of this method is lightweight and handy despite its robust tracking aspects. The tracing features of lightweight types of tools include code profiling to have a clear understanding of the app’s high-level performance. One of the best lightweight monitoring tools available in the market is Stackify Prefix.
1.3 APM Tools
Application Performance Management (APM) .NET monitoring tools enable the developers to solve recurring application issues in QA. This type of tool gathers information on repeated problems and enables the .NET app development team to deal with more complex software development problems. APM solutions offer logging, database queries, web service calls, exceptions, and so on. Besides this, it helps developers to have a clear understanding of the root cause of the app’s issues and guides them in fixing bugs to improve the app’s performance. APMs are generally expensive and only large enterprises can afford them.
2. Best Tools To Monitor ASP.NET Applications
Some of the best tools for monitoring .NET framework applications are –
2.1 RedgateANTS

RedgateANTS is one of the best monitoring tools available in the market that makes it simple to locate any performance issues in the data access layer. It helps the developers to find out the slowest activity in the application. It comes with something called a call tree for .NET performance profiling. This offers the developers data for every method. Besides this, it also helps in identifying database queries, costly methods, and web requests. Basically, the Redgate ANTS performance profiler is one such tool that comes with amazing features for .NET app monitoring. It helps in profiling .NET languages like C# in a line-by-line manner. Similarly, it also narrows down to code analysis to find issues with the help of a line-level timing approach.
Features of RedgateANTS
- C# profiling for async source code
- Profile SQL queries
- Profiler’s result analyzing
- Third-party code decompilation
2.2 dotTrace
dotTrace is a popular .NET performance profiler tool that works in Visual Studio. It enables the developers to detect and analyze the performance statistics of the application. With the help of dotTrace, a developer can profile all types of .NET applications and can locate performance degradation in different types of NET applications which include Dot Net Core, desktop applications, and ASP.NET apps. Besides this, it also helps developers to have a new profiling experience where they can slice and dice profiling data with the use of the call tree, filters, or diagrams.
Features of dotTrace
- Multi-OS support
- Timeline and profiling modes
- Deep Visual Studio Integration
- Analyze slow HTTP requests and SQL queries
2.3 OpServer
OpServer is a famous .NET monitoring tool when it comes to checking the infrastructure of the developed application. This tool is a product by the Stack Exchange team, which runs Stack Overflow, the popular platform for application developers. OpServer is a tool that collects important data at the host level of the application which means at the software and hardware level. This tool helps the .NET developers to monitor servers, SQL clusters, switches, HAproxy, PagerDuty, Exception Logs, Cloudflare DNS, and more. OpServer is an easy-to-use tool that offers a quick overview of the application with a detailed report.
Features of OpServer
- Multi-OS support
- Monitoring of Servers
- Elasticsearch monitor
2.4 AppDynamics

AppDynamics is another .NET monitoring tool that enables developers to monitor and handle the app’s performance. It is a tool that can be easily installed into the systems and just after its installation, the tool starts showing wonders and making it simpler to gather performance metrics. It contains a Business Transaction Dashboard for managing business transactions that keep tabs on the efficiency of business transactions in terms of transaction status, key statistics such as calls per minute, slow transactions, and much more. Besides, it comes with the most scalable architecture and supports all .NET monitoring frameworks. AppDynamics solutions enable the .NET developers to deploy applications with more confidence and at a faster rate as it helps you to visualize the ASP .NET application flow.
Features of AppDynamics
- Activity Dashboard
- Anomaly Detection
- Application Management
- API
2.5 AQTime
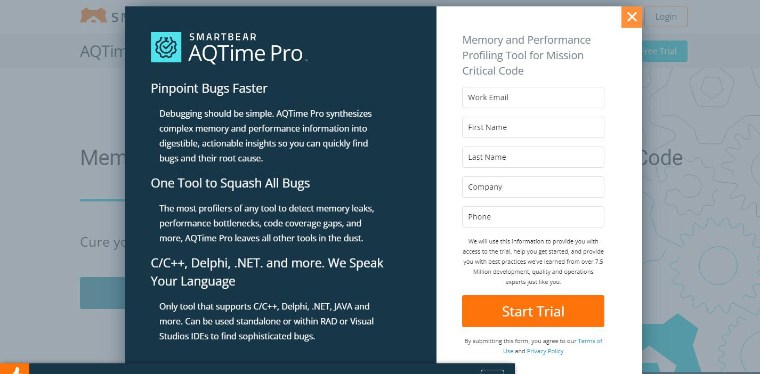
AQTime is a tool that the .NET developers use for multiple optimization tasks which can eventually help in improving the app’s memory usage and performance. It comes with a set of profiles for analysis of various aspects of the application. It also helps the developers to carry out sophisticated application performance analyses of the .NET software’s functions. Besides this, AQTime also tracks performance issues of the application and looks out for memory leaks. It enables the developers to analyze resource usage. .NET code coverage monitoring is also possible with AQTime.
Features of AQTime
- Memory Leaks Checking
- Performance Profiler
- Delphi Profiling
- Intuitive Reporting
2.6 Retrace
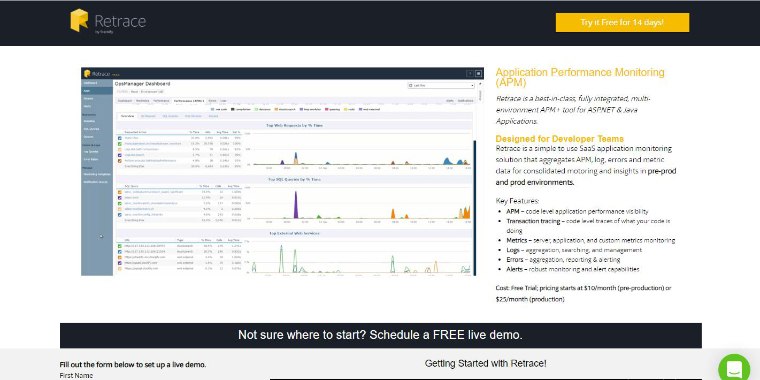
Stackify Retrace is one of the most widely used software monitoring tools for ASP.NET as it is easy to use and understand. It enables the developers to offer complete end-to-end solutions which include transaction tracking, application monitoring, metrics logging, error reporting, and robust alerting. Its “App Score”, an in-house designed app offers granular details of the Apdex score. It helps us understand how long the code takes to process a web request. Besides this, the web platform of this tool shows server and application performance which includes details of CPU and memory usage, satisfaction scores, errors per minute, and much more.
Features of Retrace
- Code Profiling
- Error Tracking
- DB Monitoring
- Code-level Insight
3. Conclusion
As seen in this blog, when it comes to creating a robust application, the process is very complex as it includes things like complex coding, usage of technologies like CSS, HTML, & JS, and more. Application development also includes processes like database connectivity, mapping entities, libraries, server response time, etc. And to carry out all these things smoothly, without slowing down the application after its implementation, monitoring tools are required. Software monitoring tools help in making the app development process easier in terms of debugging and optimizing the app’s performance. Some of such tools are listed here in this blog and they help developers debug, monitor, and optimize the .NET app’s performance in an effective manner.




Comments
Leave a message...